A quality lead represents a high potential sales opportunity. This report helps teams evaluate lead quality distribution and improve assignment strategies.
A quality lead is a prospect with a strong likelihood of converting into a customer. Typically, these leads meet a combination of general sales success indicators along with criteria that are unique to your business.
Note
The definition of a quality lead varies by organization. Each company should define its own criteria based on industry, sales process, and target audience.
A quality leads report measures how many high-value leads each salesperson has received over a selected period (for example, the last 30 days). This helps sales managers ensure fair distribution and evaluate lead allocation strategies.
Example
A sales manager generates a quality leads report using internal criteria such as:
Leads must include both a phone number and email address
Email must belong to a professional domain
Lead source must be from live chat or booked meetings
After reviewing the report, the manager notices that some salespeople have received significantly more high-quality leads than others.
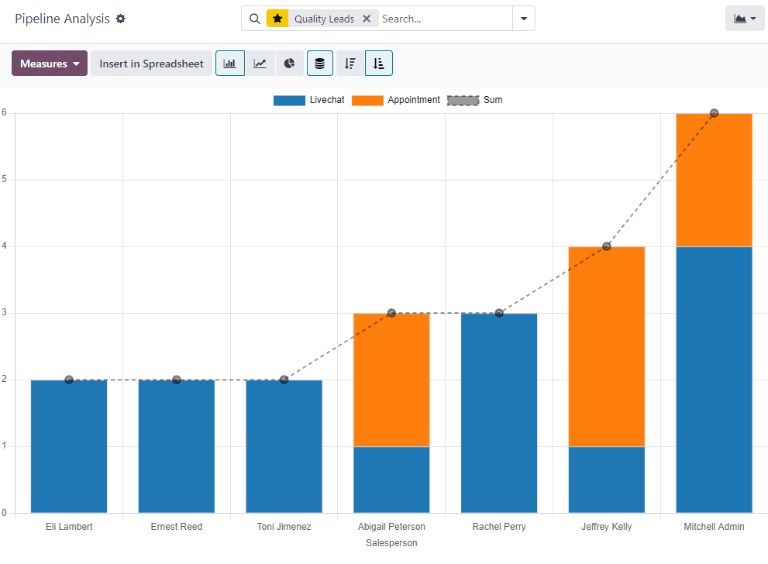
An example of a quality leads report in the Odoo CRM application.
Based on these insights, the manager may adjust lead assignments to create a more balanced distribution.
Create a quality leads report
Navigate to:
CRM app ‣ Reporting ‣ Pipeline
This opens the Pipeline Analysis dashboard.
Click the Search… bar and remove any existing filters to start fresh.
Next, click the dropdown icon next to the search bar and select Add Custom Filter.
Add custom filters
To generate a meaningful quality leads report, apply filters based on:
Time period (when leads were created)
Assigned salesperson
Sales team (optional)
Inclusion of archived leads (optional)
Custom quality criteria
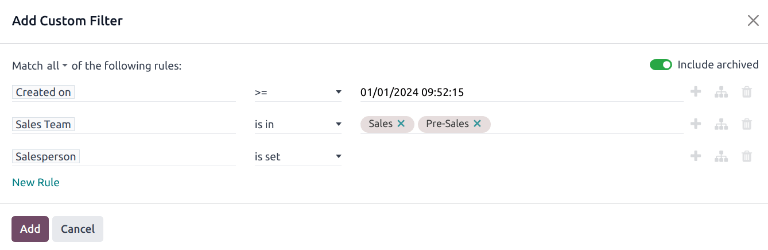
An example of the Custom Filter pop-up window with all of the rules configured.
Set a date range
Start by defining the reporting period:
Select Created On
Choose one of the following operators:
>= to include records from a specific start date
is between to define both start and end dates
Use the date picker to select the desired range.
Filter by sales team (optional)
Note
Skip this filter if you want results for the entire organization.
To limit results to specific teams:
Add a new rule
Select Sales Team
Set operator to is in
Choose one or more teams
Exclude unassigned leads
Add another rule:
Select Salesperson
Set operator to is set
This ensures only leads assigned to a team member are included.
Include archived leads (optional)
Tip
Including archived leads provides a more complete dataset, as it captures both active and inactive records.
To enable this:
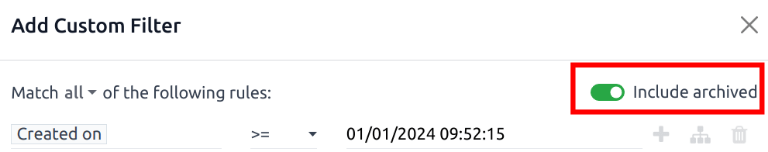
Turn on the Include archived toggle in the filter window
The Add Custom Filter pop-up with emphasis on the Include Archived toggle.
Define quality lead criteria
The most important step is defining what qualifies as a high-quality lead for your business.
Common filtering options include:
Email / Phone: ensures valid contact details are present
Source: identifies leads from high-performing channels
Stage: focuses on leads at meaningful pipeline stages
Medium: evaluates the effectiveness of marketing channels
Campaign: tracks performance of marketing campaigns
Tags: filters based on custom labels
Lost Reason: excludes leads that were disqualified
Tip
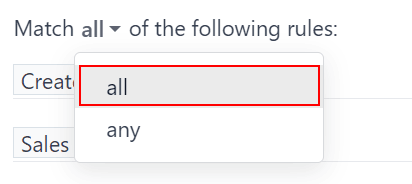
Pay attention to the condition at the top of the filter window:
Match all rules → stricter filtering (recommended)
Match any rules → broader results
Close up of the match rule options on a add custom filter pop-up window.
View the report
Important
Make sure the filter condition is set to match all rules to ensure accurate results.
Close up on the match all rules option on the add a custom filter pop-up window.
Click Add to apply the filters.
The report will appear as a bar chart, typically grouped by stage.
Adjust grouping
To analyze results by salesperson:
Open the dropdown menu next to the search bar
Under Group By, select Salesperson
For deeper insights:
Add a secondary grouping such as Active status
This separates active and lost leads visually
Understand the results
The report now shows how many qualities leads each salesperson has received within the selected timeframe.
With grouping applied:
Results are segmented by salesperson
Additional color indicators highlight lead status (active vs lost)
Save the report
To reuse this report:
Open the dropdown menu
Under Favorites, click Save current search
Rename it (e.g., Quality Leads Report)
Click Save
This allows quick access in the future without rebuilding filters.